
Introduction#
Peer review at top AI conferences is often treated as a largely field-neutral filter: strong work rises, weak work falls, and differences in outcomes across subareas primarily reflect differences in submission volume and quality. This is typically the case every year across all conferences (e.g., ICLR, NeurIPS, ICML, etc). Yet many researchers have informally suspected a strange bias when they receive their peer reviews recently. This post examines a deliberately narrow hypothesis:
💡 Hypothesis
Some research areas have systematically different odds of acceptance than other areas.
To probe this, I use publicly available peer-review metadata from a major AI conference series hosted on OpenReview. For each year, I collect submissions and decisions, extract review ratings and (where available) topical labels (e.g., “Primary Area” and author-provided keywords), and compute both global and area-specific acceptance rates. What I then have is a full dataset to probe this hypothesis across the years. I go into a full story-like data exploration and analysis in this post. If you want the short and sweet version, then you can skip to the Findings TL:DR section.
It must be stated before we dive into the findings; the goal of this blogpost is not to attribute intent or fault to any group. Instead, we use publicly available data to observe specific trends and patterns, thus, readers can draw their own conclusions about what they might imply.
Data#
The analysis in this blogpost is based on publicly accessible peer-review metadata hosted on OpenReview, specifically from ICLR (International Conference on Learning Representations), covering 2018–2025. ICLR is a useful testbed for this question for a practical reason: it provides an unusually complete public record of the review process at scale-submissions, review texts, numerical ratings, and final decisions are generally accessible through a consistent platform and API.
This choice is primarily methodological. Many other top AI venues either (i) do not make review metadata systematically available, (ii) rely on opt-in visibility where authors can choose whether materials appear publicly, or (iii) expose only partial slices of the process. By contrast, ICLR’s OpenReview infrastructure makes it possible to assemble a large, multi-year dataset without selectively sampling “visible” papers in a way that could bias the analysis.
Data Creation#
To build the dataset, I queried the OpenReview API for each ICLR year from 2018 to 2025 and retrieved all submissions along with their associated decision records and review threads. Concretely, each submission is identified by its OpenReview forum/note ID, which allows us to collect (i) the paper metadata (title, abstract, author-provided keywords when available), (ii) the review ratings and confidences from official reviews, and (iii) the final outcome.
A practical complication is that OpenReview’s schema and venue configuration evolve over time (e.g., differences between older and newer APIs, changes in invitation names, and year-to-year variation in how decisions are stored). The scraping code therefore uses year-specific logic to ensure that submissions, reviews, and decisions are extracted consistently. The details of this cleanup are mostly engineering rather than insight.
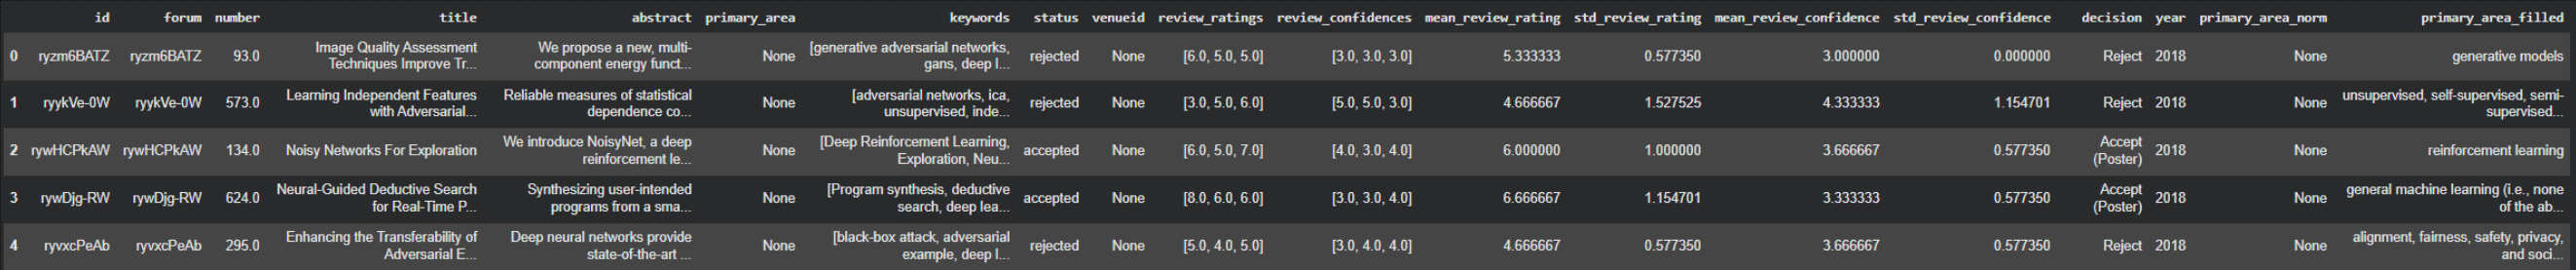
Below is a snapshot of the dataset after creation. As you can see, after some engineering, we get each paper’s title, abstract, primary area, keywords, status/decision, review ratings, review confidence’s, and year.

Data Cleanup#
Although OpenReview provides a rich public record, the raw data is not immediately analysis-ready. Across years, topical labels such as a paper’s “Primary Area” are not always present (especially in older years), and decision information may not appear either. Similarly, submissions can include non-standard decision (e.g., withdrawals, desk rejections, workshop invitations) that must be handled consistently when computing acceptance rates. As a result, I had to do some structured data-cleanup.
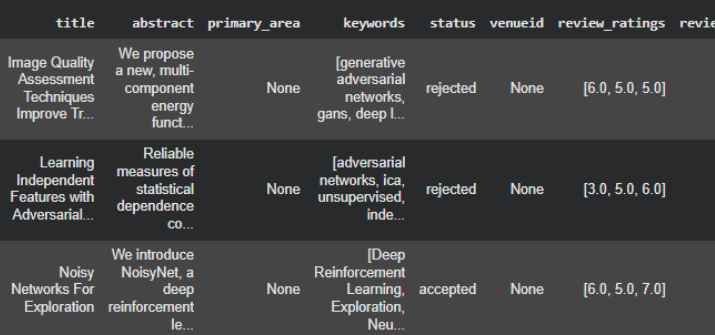
Firstly, not every submission contained a populated “Primary Area” field, but every submission did include a list of author-chosen keywords. Some examples below.
To fix this and not just throw away this data, I used a lightweight imputation strategy based on author-provided keywords. Specifically, I first learned an empirical mapping from keyword to primary area using years (and submissions) where the primary area label is available, by identifying which area each keyword most frequently co-occurs with. I then applied this mapping to submissions with missing primary areas by aggregating the mapped areas suggested by their keywords (e.g., via a simple majority vote), yielding an inferred area label for otherwise unlabelled papers. This procedure is intentionally simple and transparent: it is not meant to perfectly classify every submission, but to provide a consistent, reproducible way to assign coarse topical labels when the conference metadata are incomplete. You can see examples of the filled in areas in the “primary_area_filled” column. Comparing the generated area with the title for these examples shows this worked in a neat way.
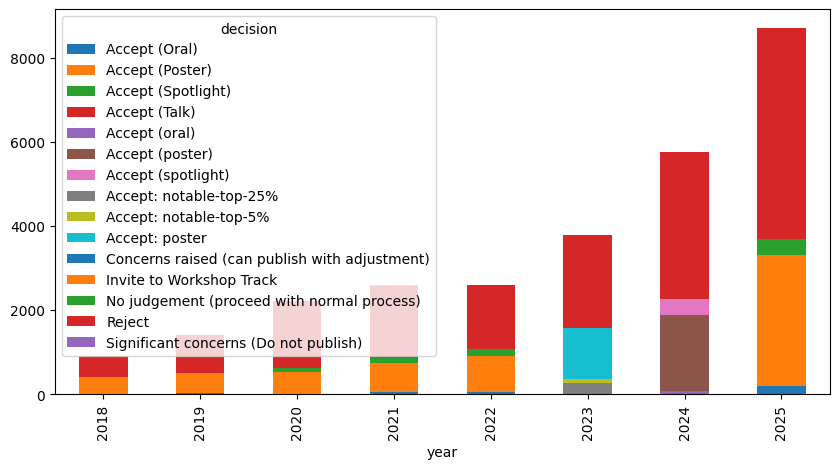
Decision outcomes also required standardization. In the raw OpenReview records, the “decision” field can be verbose and year-specific—for example distinguishing posters, orals, spotlights, and various administrative states (e.g., “no judgement,” “concerns raised,” or workshop invitations). Just look how many categories there were below!
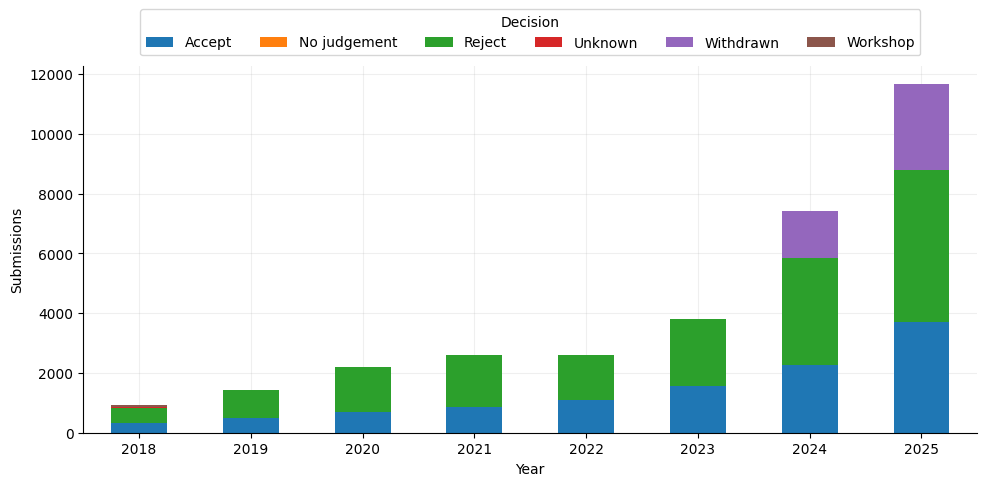
For the analyses in this post, I therefore mapped these heterogeneous strings into a small, consistent set of categories: Accept, Reject, Withdrawn, Workshop, No judgement, and Unknown (used when a decision record is missing or cannot be parsed). This prevents the results from depending on strange wording.
Full Results/Findings#
With a cleaned dataset in place, I now prevent a fully detailed results section below.
Preliminary Data Exploration#
I begin with a brief exploratory pass over the dataset. This step is purely exploratory: it will help us look at the data is a whole.
Starting with the submissions we see per year, we see it increases linearly until 2024 where the submissions starts to blow up. Across all years, ‘Reject’ constitutes the largest share, while the number of ‘Accept’ decisions rises in absolute terms as total submissions increase.
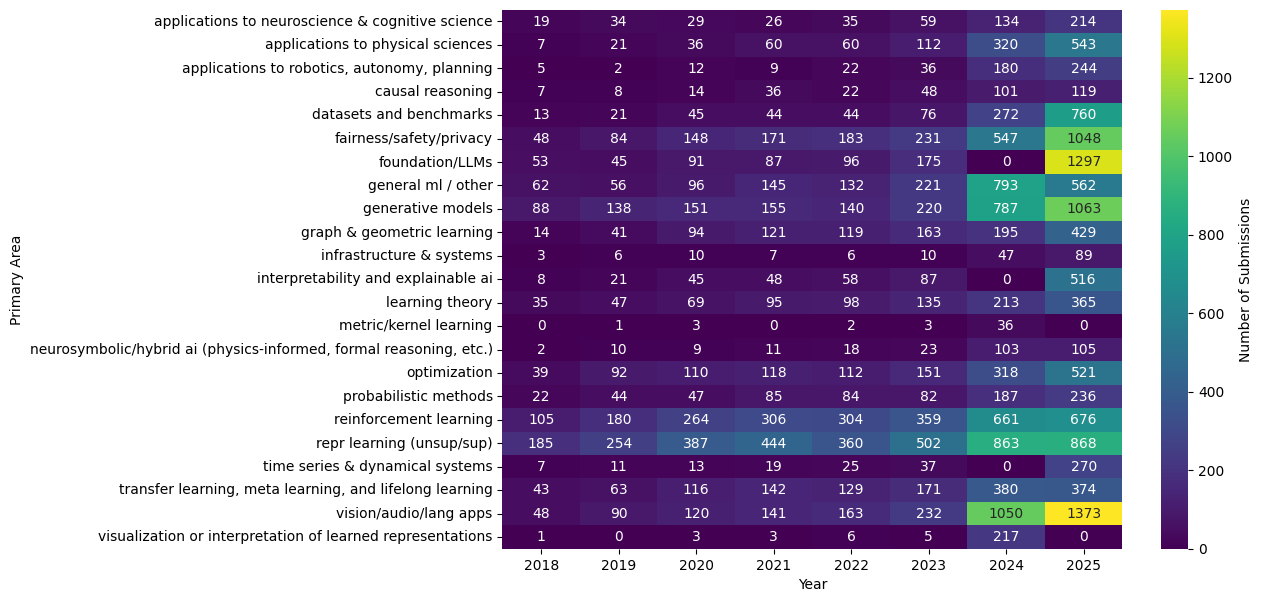
Submission volume is highly uneven across areas and evolves substantially over time, which is indicative of trending fields and topics year to year. Several areas (e.g., vision/language modalities, LLMs, etc.) expand markedly in later years, indicating both overall conference growth and shifting topical composition. Smaller areas remain low-count throughout, such as “Time Series”.
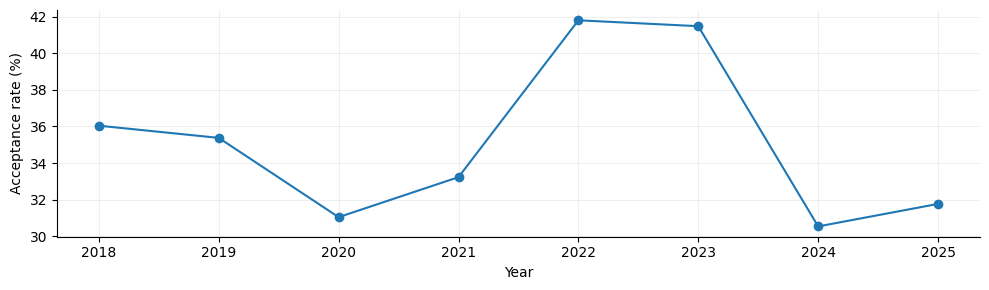
The overall acceptance rate varies across years, which we expect due to venue limits, submission rates, etc.
Acceptance Rates#
So to start investigating our hypothesis thoroughly, we first want to look at the trending topics per year.
We see in earlier years (e.g., 2018-19), topics like generative models and representation learning were to hottest areas. This makes sense as in these years we saw massively popular papers in these areas. [1, 2]. Then in more recent years, areas like LLMs and vision/lang applications become the most popular which makes sense again as we entered the age of LLMs. We can also look at the top keywords used in these areas per year too as primary areas can be kind of vague. In ‘vision/audio/lang applications’, the top keywords were {large language models (n=73), large language model (n=55), diffusion model (n=37)}, which shows that LLMs dominated not only their primary area but the applications area too!
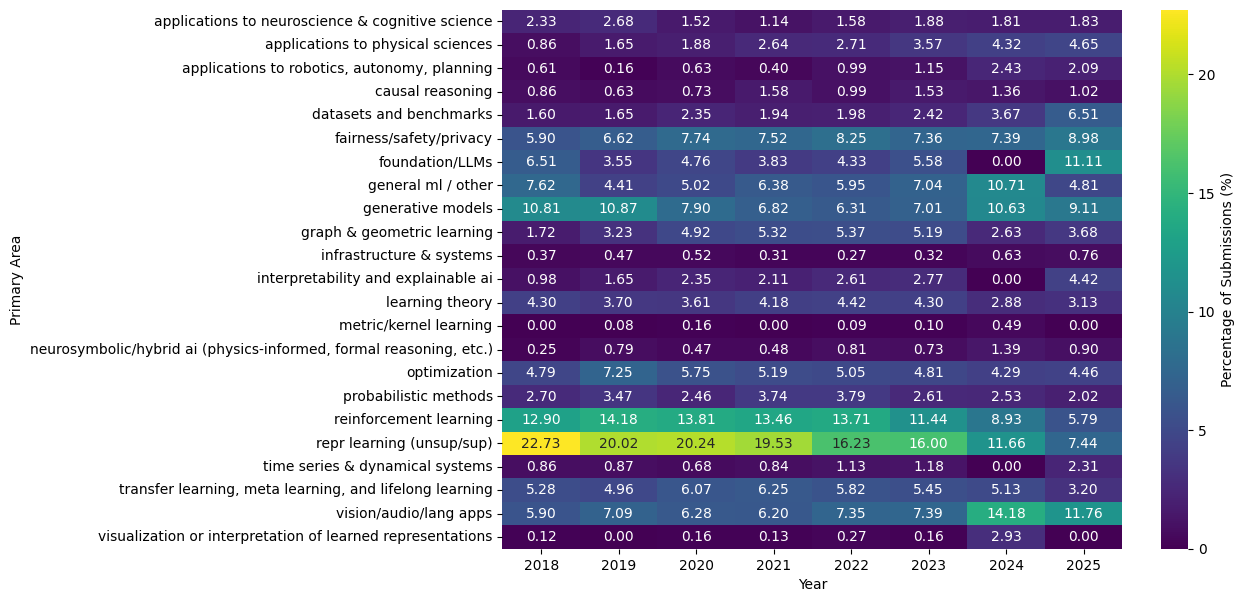
But what if we look at the acceptance rates per area per year. We already know what topics were popular, but submissions doesn’t equal acceptance/good research.
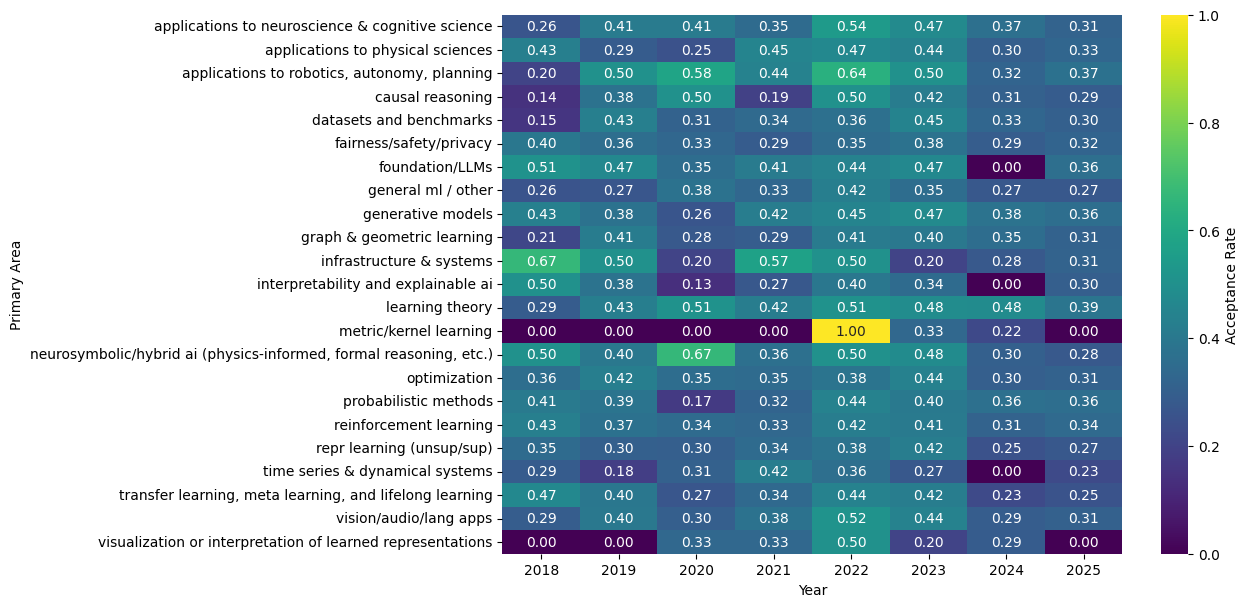
In early years, topics like XAI were highly accepted, but they only made nearly 1% of submissions. LLMs in recent years, which we know were massively popular, averaged around 36% acceptance rate which is quite high but not stupidly inflated. To try and digest this info better, we can look at the deviation from the global acceptance rate that year.
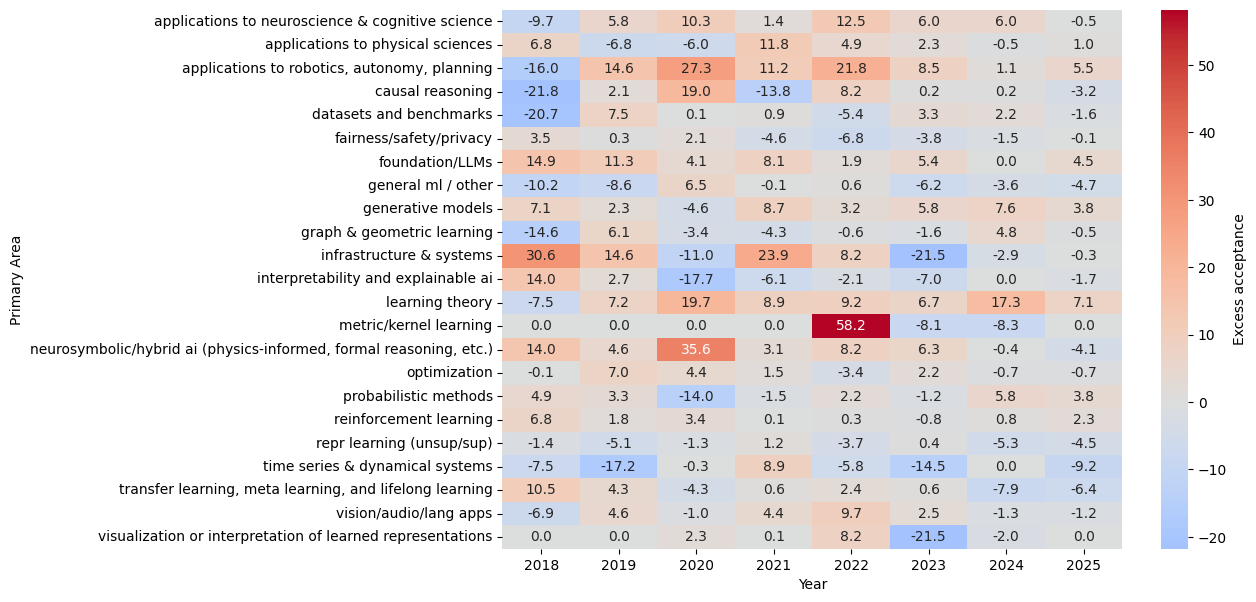
Again, in early years, it is hard to draw conclusions because some topics don’t even reach ~100 submissions. We can see some patterns in 2025 however. We see areas, such as ‘Robotics’ and ‘LLMs’, have the highest acceptance rate above the global rate. We also see areas, such as ’transfer learning’ and ’time series’, have a very low excess acceptance rate. In fact, conclusions are hard to draw from this as it matters how many submissions there were, and if it was the hot topic that year.
Paper Ratings#
Beyond acceptance outcomes, a parallel discussion around top AI conferences concerns the ratings themselves. A recurring claim, often raised informally in online discussions, is that as conferences scale and rely increasingly on reciprocal reviewing, the distribution of review scores may shift downward (or become more compressed), potentially reflecting heavier reviewer load or altered norms around what constitutes an “accept-level” score.
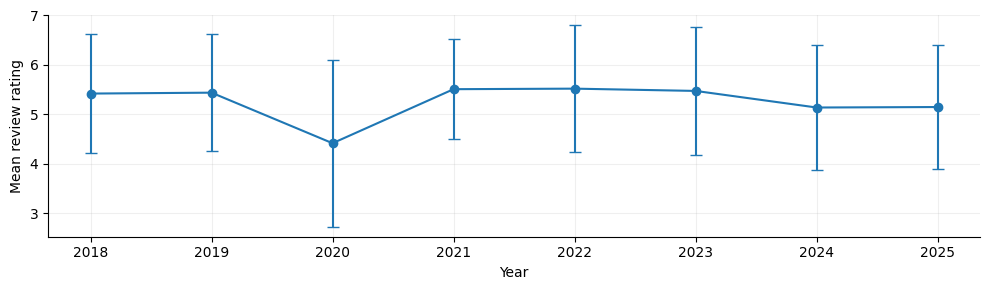
If we look at this in ICLR’s case, which introduced reciprocal reviewing in 2025, we can’t observe a dip at all compared to previous years. But, maybe our hypothesis is still correct, and we need to see if some areas are more favoured than others?
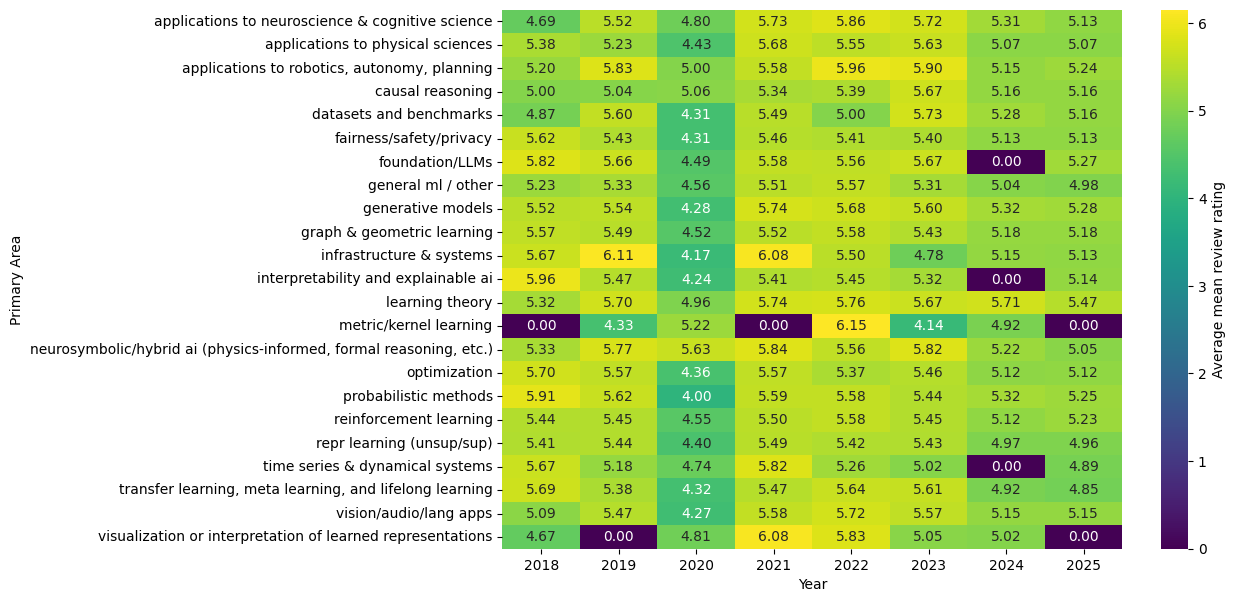
Well with this we can see similar trends to the acceptance rate plots we showed earlier. In 2025, fields like ‘LLMs’ and ‘Robotics’, were favoured more on average whilst fields like ’time series’ and ’transfer learning’, were favoured less than most other areas.
Parametric and Non-Parametric Analyses#
The previous analyses doesn’t allow us to see if a paper actually deserved to be accepted, or if a field actually has an acceptance bias applied to it. So, we can try and investigate these via models. Specifically, if I fit a simple logistic regression model at the paper level. The dependent variable is a binary indicator of acceptance (Accept vs Reject). The key covariates are the paper’s mean review rating, a categorical indicator for research area, and a categorical indicator for year. In this specification, the area coefficients can be interpreted as score-conditioned shifts in the odds of acceptance relative to a baseline area: a positive coefficient indicates higher acceptance odds at the same score and year, while a negative coefficient indicates lower odds. This can tell us if areas have some bias, as two papers in the same year, with identical scores, should have ‘similar’ acceptance chances regardless of the field.
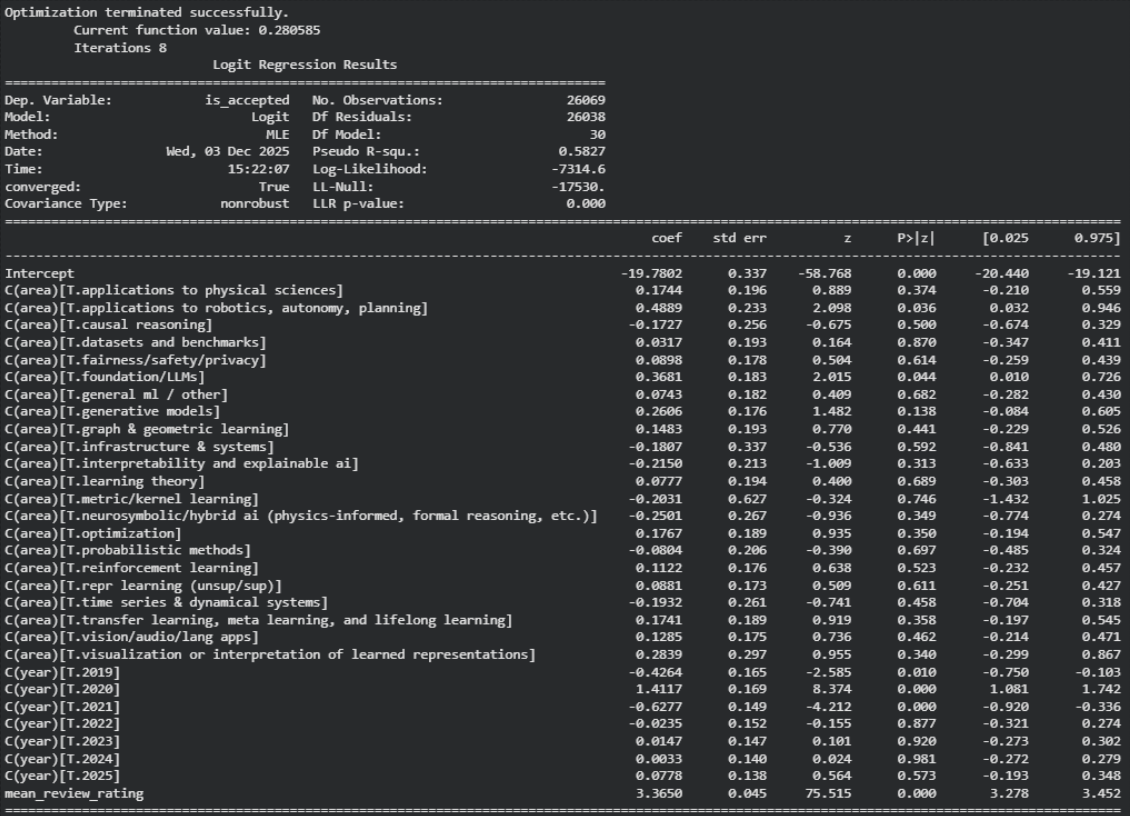
The fitted model confirms that review score is the dominant determinant of acceptance, while year effects capture changes in global selectivity across cycles. Importantly for the hypothesis, the area terms measure whether some subfields have higher/lower acceptance odds at the same score and year: only a small subset show a statistically detectable positive “boost”. Notably ‘LLMs’ (+0.37, p = 0.044) and ‘robotics’ (+0.49, p = 0.036), while most other areas have effects that are not clearly different. Interestingly, some areas see a negative “boost”; mainly “time series” (10.19, p = 0.458).
As a complementary check, I also estimate acceptance probabilities non-parametrically, without fitting a model. I bin papers by their mean review rating (in 0.5-point increments) and compute the empirical fraction accepted within each (area, score-bin) cell (discarding cells with very small counts).
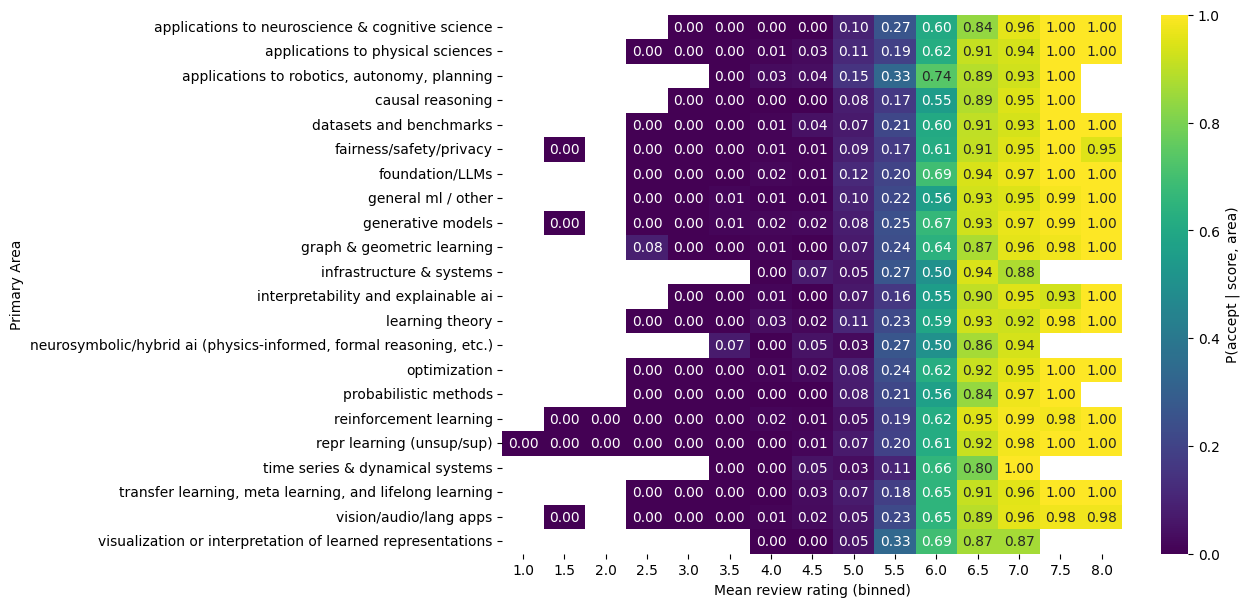
This figure above makes the main structure explicit: acceptance is strongly increasing in score across all areas, with near-zero acceptance at low scores and near-certain acceptance at high scores. At the same time, in the mid-score region where most borderline decisions occur, some areas exhibit modestly higher or lower acceptance fractions than others within the same score bin. For example, at an average score of 6.0, ‘Robotics’ and ‘LLMs’ have higher acceptance rates. At an average score of 6.5, ’time series’ and ‘probabilistic methods’ see an notably lower acceptance rate. This pattern is consistent with the logistic regression result: score explains most of the decision, while any area-level differences appear comparatively small and concentrated near the decision boundary.
Finally, to further quantitatively validate our hypothesis, it is useful to note that differences in acceptance across areas need not reflect differences in “standards” alone: they may also be shaped by how fast an area is growing or contracting within the conference. To explore this, the figure below plots each area’s excess acceptance (y-axis, in percentage points relative to the conference baseline) against its submission growth relative to the average area from the pre to post period (x-axis, “excess” log growth). Areas to the right have grown faster than the typical field; areas above zero are accepted at higher-than-baseline rates..
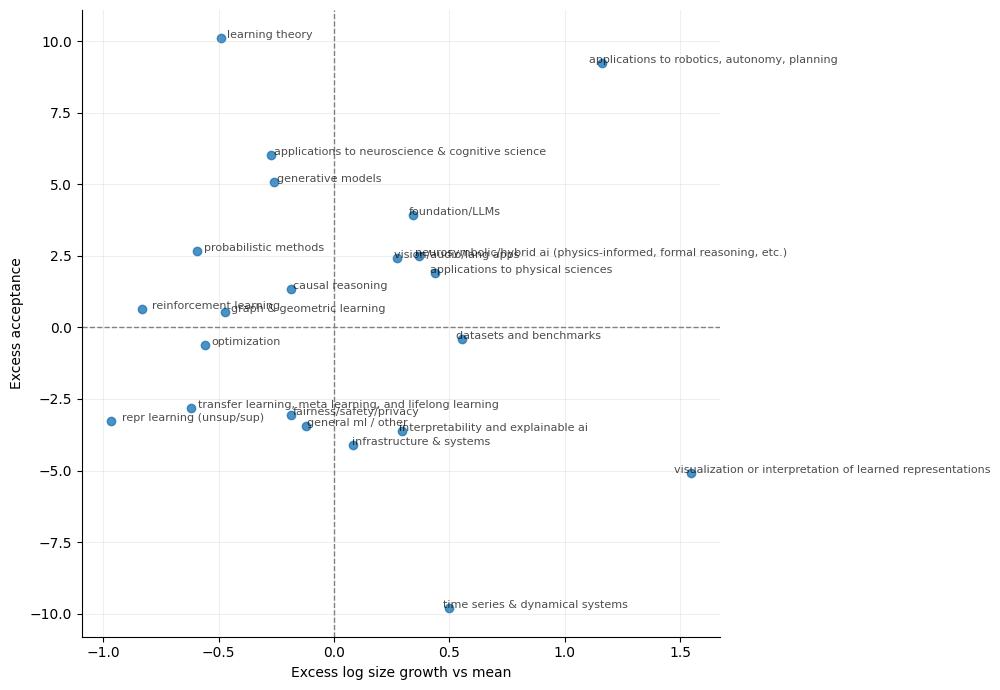
Before this image, it could be argued that ‘Robotics’ and ‘LLMs’ may have higher acceptance rates because they are hot topics and thus want to be showcased more in the conference. But this image shows that this may not be the case. Areas like ‘XAI’ and ‘PINNs’ are just as popular to ‘Robotics’ and ‘LLM’s but don’t have the same excess acceptance rate as them.
Taken together, these analyses suggest that acceptance decisions are primarily explained by review scores, but not perfectly so. After our analysis, most research areas appear broadly comparable; however, a small subset exhibits a modest but statistically detectable acceptance advantage relative to a baseline area. Specifically, ‘Robotics’ and ‘LLMs’ seem to not only get reviewed more favorably compared to other fields, but papers in different fields with the same mean review score have a lower chance of getting in to the conference. The one thing we can’t show is why?
Findings TL;DR#
Across 2018–2025, acceptance at a top AI conference is overwhelmingly driven by review score: the empirical heatmap shows the probability of acceptance given a mean review score rises sharply with score in every area, with notable differences between areas that mainly appear in the mid-score “decision boundary” region rather than at the extremes. For example, at an average score of 6.0, ‘Robotics’ and ‘LLMs’ have higher acceptance rates. At an average score of 6.5, ’time series’ and ‘probabilistic methods’ see an notably lower acceptance rate.
When we zoom out to the AI ’ecosystem’ dynamics, previously it could be argued that ‘Robotics’ and ‘LLMs’ may have higher acceptance rates because they are hot topics and thus want to be showcased more in the conference. But this image below shows that this may not be the case. Areas like ‘XAI’ and ‘PINNs’ are just as popular to ‘Robotics’ and ‘LLM’s but don’t have the same excess acceptance rate as them.
Overall, my analysis shows that the hypothesis can be somewhat validated. For some strange reason, which we can’t prove as to why, some sub-areas have a higher chance of getting into ICLR just because of the area alone. We showed it was not because of area growth, but due to an unexplainable ‘bias’ towards those fields.
Conclusion#
Overall, the evidence is consistent with a modest version of my hypothesis. Review score remains the primary determinant of acceptance, but both the regression and the score-binned, non-parametric estimates indicate that, conditional on similar scores and the same conference year, some research areas have systematically higher acceptance probabilities than others.
Importantly, this pattern is descriptive rather than diagnostic: the data support the presence of an area-associated residual effect, but they do not identify a mechanism or intent.
Relating excess acceptance to relative area growth further suggests that topical expansion alone is not sufficient to explain the observed differences; some areas appear over- or under-represented even after accounting for broad shifts in submission volume.
If you want full access to the data or my data exploration, then you can find it at my GitHub repo below!
References#
[1] Karras, T., Aila, T., Laine, S. and Lehtinen, J., 2018, February. Progressive Growing of GANs for Improved Quality, Stability, and Variation. In International Conference on Learning Representations.
[2] Bińkowski, M., Sutherland, D.J., Arbel, M. and Gretton, A., 2018, February. Demystifying MMD GANs. In International Conference on Learning Representations.